Software vendor audits cost real money, and most IT organizations still find out how much the hard way. This article breaks down where license risk actually comes from, how to calculate your true compliance position, and how the same discipline that keeps you audit-ready also cuts real dollars from your software spend.
The Audit Question Isn’t “If,” It’s “Which Vendor and When”
Ask any procurement lead how their year went and audits come up fast. According to Flexera’s 2025 State of ITAM Report, 45% of organizations spent more than $1 million on software audits over the past three years, and 23% crossed $5 million in 2025 alone. A separate industry survey covered by Block64 found that 62% of companies faced a vendor audit in 2024, up sharply from 40% the year before — and among mid-market enterprises with 5,000+ employees, the rate hit 66%.
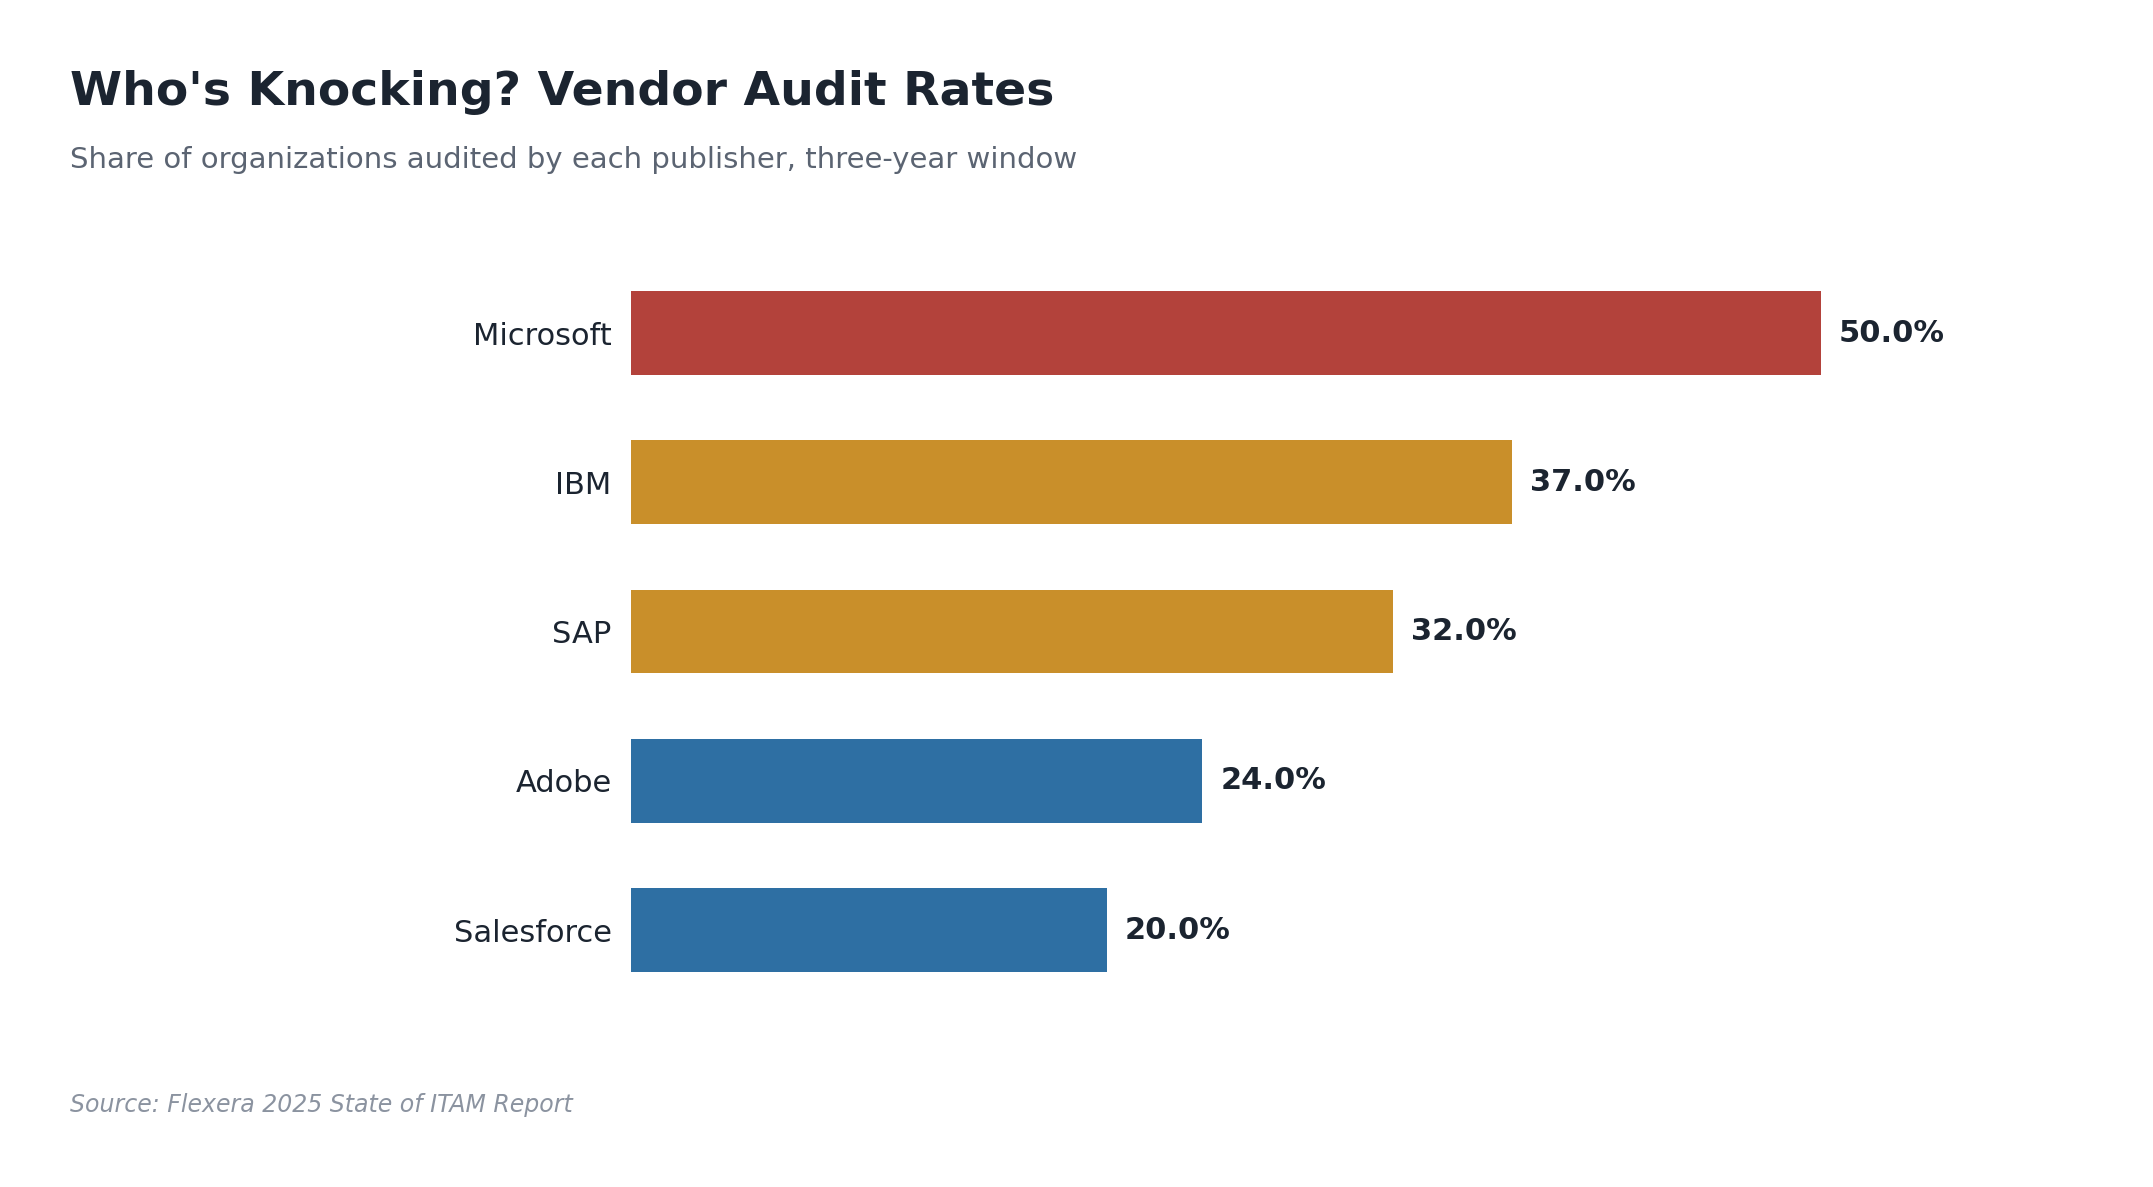
Microsoft leads the pack by a wide margin. Flexera puts Microsoft audit exposure at 50% of respondents over a three-year window, with IBM (37%), SAP (32%), and Adobe (24%) rounding out the list. Block64’s numbers tell a similar story, with Oracle and SAP each landing around 30-31%. Oracle in particular has built audits into its revenue model — reporting suggests the company generates roughly $3 billion a year through audit-driven true-ups, close to 6% of total revenue. Gartner has separately warned that as many as one in five Oracle Java users could face an audit within three years, a direct result of Oracle’s shift to per-employee Java SE subscription pricing.
It isn’t only the traditional audit letter you need to worry about. VMware customers absorbed some of the steepest cost shocks in recent memory after Broadcom’s acquisition, with certain renewal quotes jumping more than 1,000% as perpetual licenses gave way to mandatory subscription bundles. None of this required a formal audit — it just required not knowing your entitlement position before the renewal conversation started.
Why This Keeps Getting Worse, Not Better
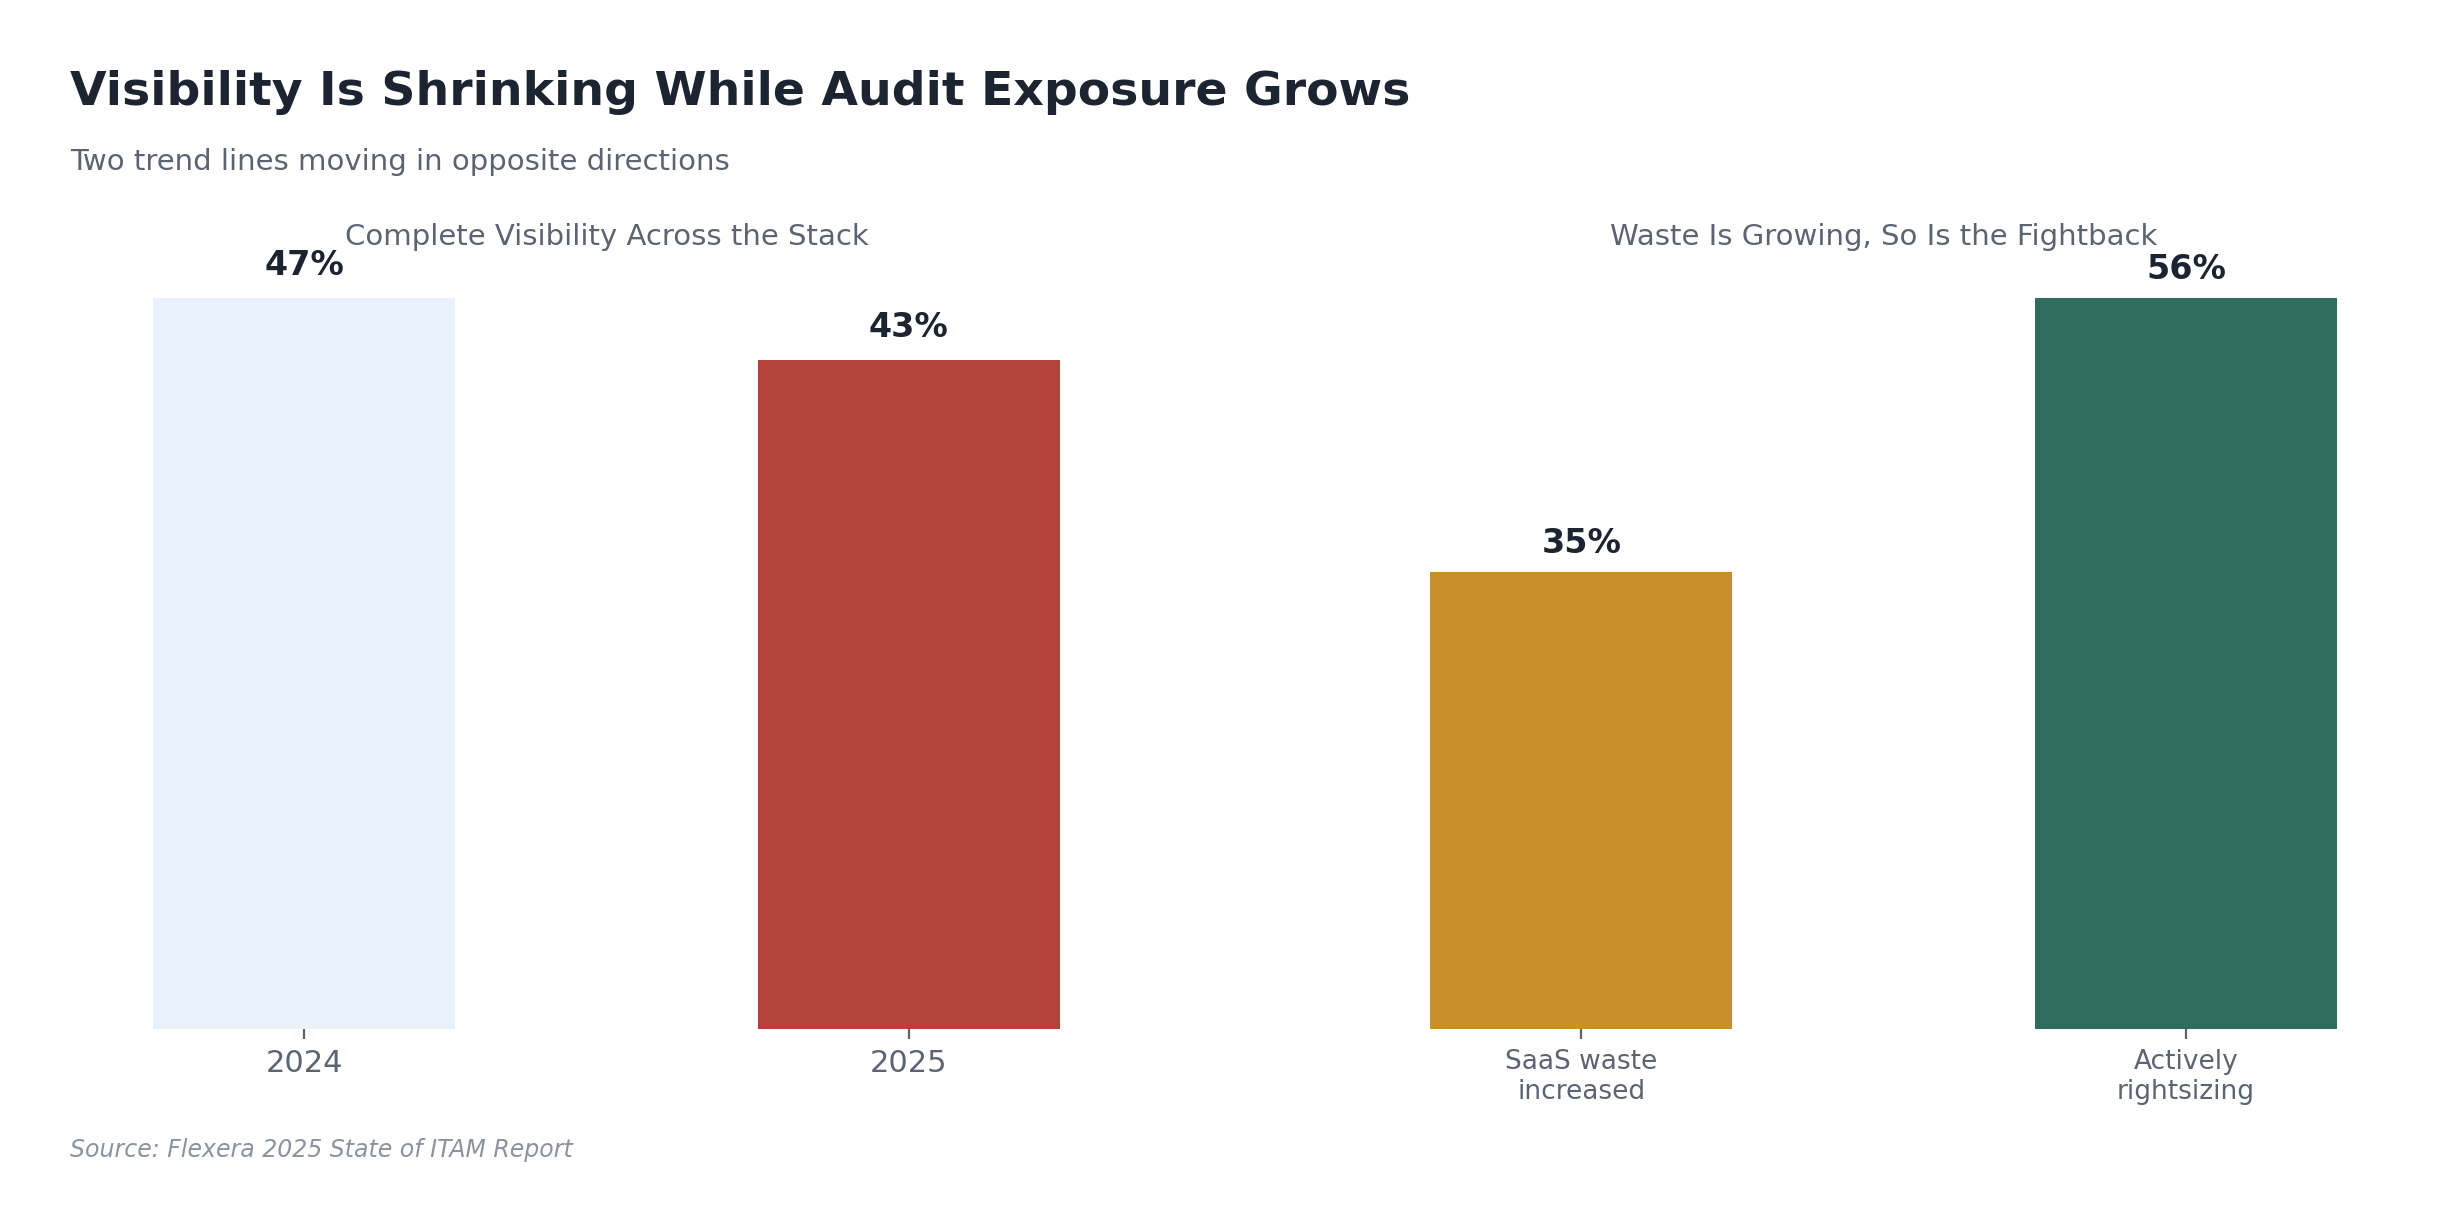
Vendors audit more aggressively when their own revenue growth slows, and that’s exactly the environment IT budgets have been operating in. Flexera also found that complete visibility across the technology stack dropped to 43% in 2025, down from 47% the year before. Fewer organizations can see their full estate at the exact moment vendors are looking harder. That gap is where seven- and eight-figure true-up bills come from.
The cost isn’t limited to what ends up on the settlement invoice, either. Block64’s survey found that 32% of organizations incurred audit-related liabilities exceeding $1 million, up from just 10% two years earlier, and that roughly one in ten organizations paid $10 million or more on vendor audits over a three-year span. Then there’s the staff time nobody budgets for: 56% of respondents said audit response consumed 11-20% of IT staff capacity, and 11% said it ate more than a quarter of their team’s time. Close to three-quarters of ITAM teams now spend some portion of their working hours on audit activity rather than the optimization work that actually saves money. Every hour spent assembling proof of entitlement for a publisher’s audit team is an hour not spent finding the next reclamation opportunity.
Effective License Position: The Number That Actually Matters
Every SAM conversation eventually comes back to one artifact: the Effective License Position, or ELP. An ELP is the reconciled answer to a simple question — for each publisher and product, are you licensed for what you’re actually running, and is anything left over?
Building one is a three-step exercise. First, discovery: inventory every installation, device, VM, and container image, because you can’t reconcile what you haven’t found. Second, entitlement collection: pull every purchase record, agreement, and contract amendment and normalize them into a single, comparable unit of measure — this is harder than it sounds when a company has been through mergers, resellers, and a decade of add-on orders. Third, mapping: lay consumption against entitlement, product by product, and calculate the gap.
That gap runs in two directions, and both cost money.
Under-Licensing Is the Obvious Risk
Under-licensing is what shows up in an audit finding — more deployed instances than purchased rights. It’s the scenario everyone pictures when they hear “compliance risk,” and it’s the one that produces the unbudgeted true-up invoice. It usually isn’t intentional. It happens through app-to-app metrics nobody re-checked after a re-architecture, virtualization rights that don’t cover a new hypervisor cluster, or a departmental team standing up extra instances without looping in procurement.
Over-Licensing Is the Quiet One
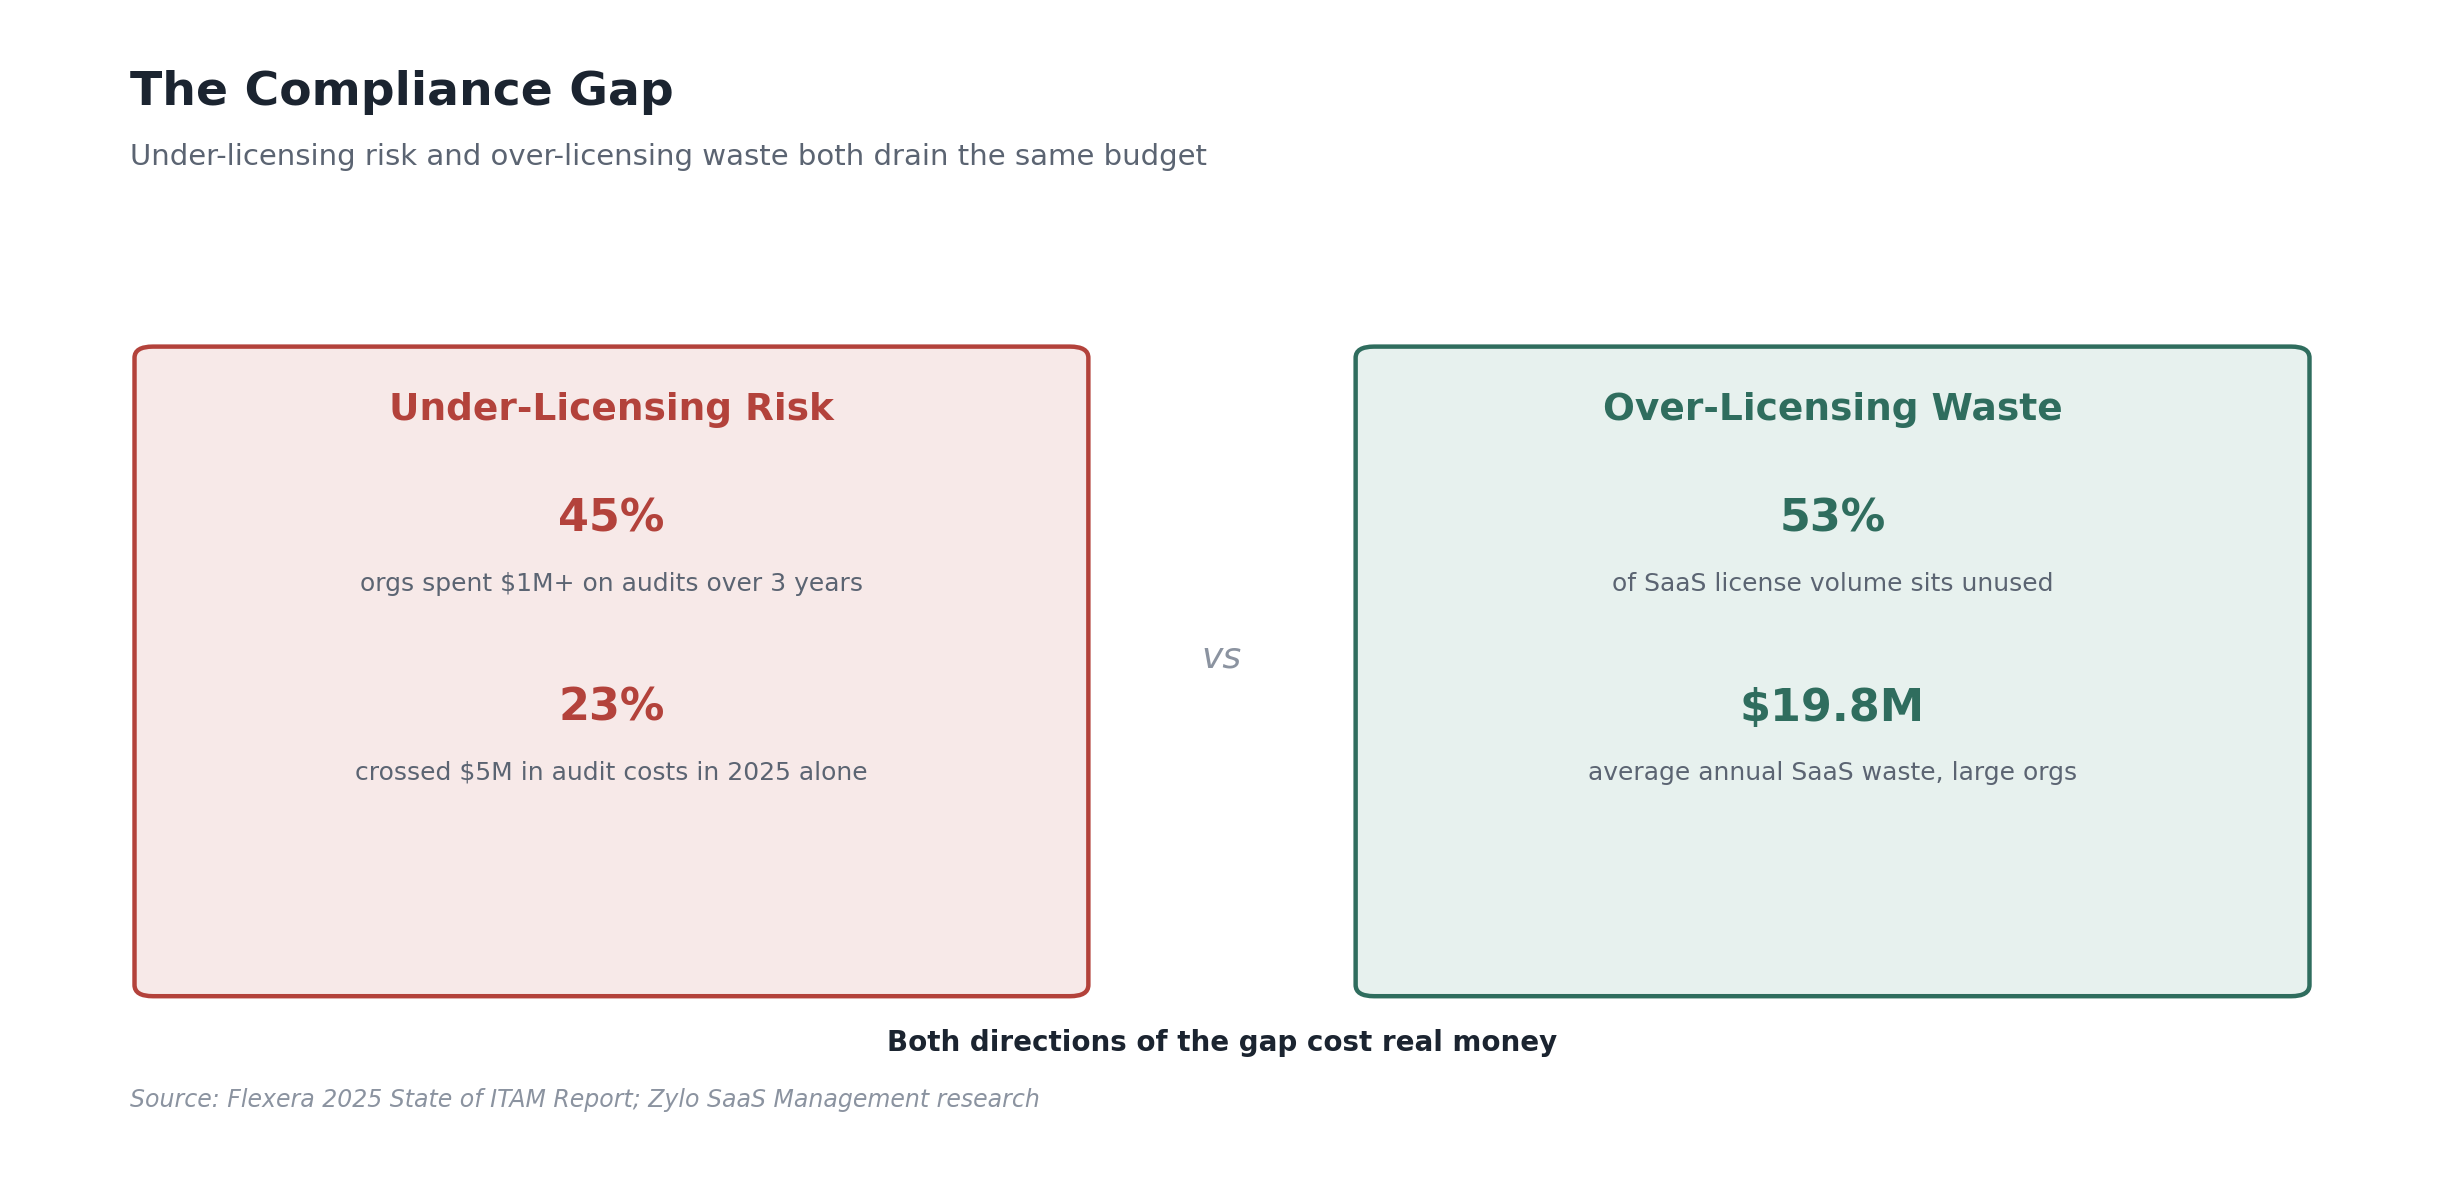
Over-licensing gets far less attention but drains just as much value. This is shelfware — licenses sitting on the books that nobody uses, seats provisioned for people who changed roles or left the company, and premium-tier subscriptions bought for a project that wrapped up eighteen months ago. Zylo’s SaaS management research puts the average share of unused or underused SaaS licenses at 53% of total license volume, which is a staggering number once you multiply it against a typical software budget. The same research pegs average annual SaaS waste at nearly $19.8 million for large, complex organizations running roughly 305 applications in their portfolio. Even scaled down for a mid-size company, the ratio holds: a meaningful chunk of every renewal check is paying for access nobody is using.
Where the Waste Actually Hides
Shelfware and SaaS sprawl rarely show up as one obvious line item. They accumulate in predictable places:
Duplicate tools bought by different departments solving the same problem — one team on Asana, another on Monday, a third still paying for a legacy project tool nobody migrated off. Named-user licenses left active for contractors and former employees because offboarding and license reclamation aren’t part of the same workflow. Enterprise agreement true-ups baked in “for safety margin” that never get revisited once the deal closes. And premium tiers purchased company-wide because a handful of power users needed advanced features, while the majority of seats sit on a tier that costs three or four times what they actually use.
Flexera’s data shows 35% of organizations say SaaS waste specifically increased over the past year, even as 56% report they’re actively rightsizing contracts to fight it. Those two numbers together describe the current state of the market pretty well: waste is still growing, but the organizations paying attention are starting to claw some of it back.
Turning Compliance Work Into Cost Recovery
Here’s the part that gets missed in a lot of ITAM conversations: the same data set that protects you in an audit is the data set that funds your next budget cycle. An accurate ELP isn’t just a defensive document — it’s a shopping list of savings.
License harvesting is the most direct win. Once you can see which seats, cores, or subscriptions are dormant, you reclaim them and apply them against future need instead of buying new. Right-sizing tiers is the second lever — mapping actual feature usage against license tier and moving the bulk of users to a lower, cheaper tier while reserving premium licenses for the people who genuinely need them. The third is renewal negotiation. Sales reps from major publishers are very good at negotiating against a customer who doesn’t know their own numbers. A team walking into a renewal with a verified ELP, a usage trend line, and a documented reclamation plan negotiates from an entirely different position than one hoping the quote looks reasonable.
None of this is theoretical. Gartner’s research into client license-optimization engagements — drawn from over 800 inquiries — found that organizations running mature, automated license optimization cut software expenses by an average of 30% in the first year of adopting the practice. The gains came from three specific habits: tuning publisher software configurations that were quietly costing more than necessary, recycling licenses instead of buying net-new, and using SAM tooling to automate reconciliation work that doesn’t scale as a manual, spreadsheet-driven exercise. None of those three things require a bigger tool budget so much as a better process wrapped around the tools already in place.
This is where Desqcon’s AEIOU framework earns its keep, because SAM maturity isn’t really a licensing problem — it’s an operating model problem. Automation handles the discovery and reconciliation work that manual spreadsheets can’t keep pace with. Edification means the people running procurement, finance, and IT actually understand license metrics well enough to challenge a vendor’s proposal instead of accepting it. Integration ties SAM data into the CMDB, ITSM, and procurement systems it should never have been isolated from in the first place. Operations is the discipline of running ELP reconciliation as a recurring process, not a once-a-year fire drill before a known audit window. And User experience keeps the whole thing from collapsing under its own bureaucracy — license requests, approvals, and reclamation need to be simple enough that people actually follow the process instead of routing around it.
Because Desqcon works across ITSM, ITOM, HAM, SAM, and CMDB disciplines without a stake in any single publisher’s tooling, the recommendations that come out of this kind of maturity assessment aren’t shaped by which platform pays a referral fee. That’s a meaningfully different conversation than the one you get from a reseller whose incentives point toward selling you more licenses, not fewer.
Building a SAM Program That Sticks
A one-time cleanup feels great and decays within a year if there’s no operating cadence behind it. The organizations that keep their ELP accurate share a few habits. They tie software provisioning to HR data, so departures trigger reclamation automatically instead of relying on someone remembering to file a ticket. They run ELP reconciliation quarterly at minimum for high-risk publishers, not annually. They involve finance and procurement in license governance instead of treating SAM as a purely technical function buried in IT operations.
Cross-functional collaboration is showing up more in the data too — Flexera found 44% of ITAM teams now work directly with cloud teams and 38% partner with FinOps groups specifically to close visibility gaps. That trend lines up with what ITIL 4 has been pushing for years: treat software asset management as a practice woven into service value chain activities like plan, engage, and improve, not a standalone compliance checkbox that only gets attention when a vendor’s audit notice arrives.
None of this requires picking a side in the tooling debate or replacing every system you already own. It requires an honest inventory, a clean entitlement record, a documented ELP, and a process for keeping all three current. Vendors will keep auditing more aggressively as their own revenue targets tighten — that part of the landscape isn’t changing. What’s within your control is whether you show up to that conversation with a defensible position and a list of savings already banked, or with a spreadsheet nobody’s touched since the last renewal.
If you’re not sure where your organization actually stands, that’s usually the first thing worth finding out. A SAM maturity assessment gives you a clear-eyed read on your current ELP accuracy, audit exposure, and reclamation potential before a vendor forces the question — worth a conversation if it’s been a while since anyone looked.